Next: Histogram Up: Video Effects Previous: Gradient Contents Index
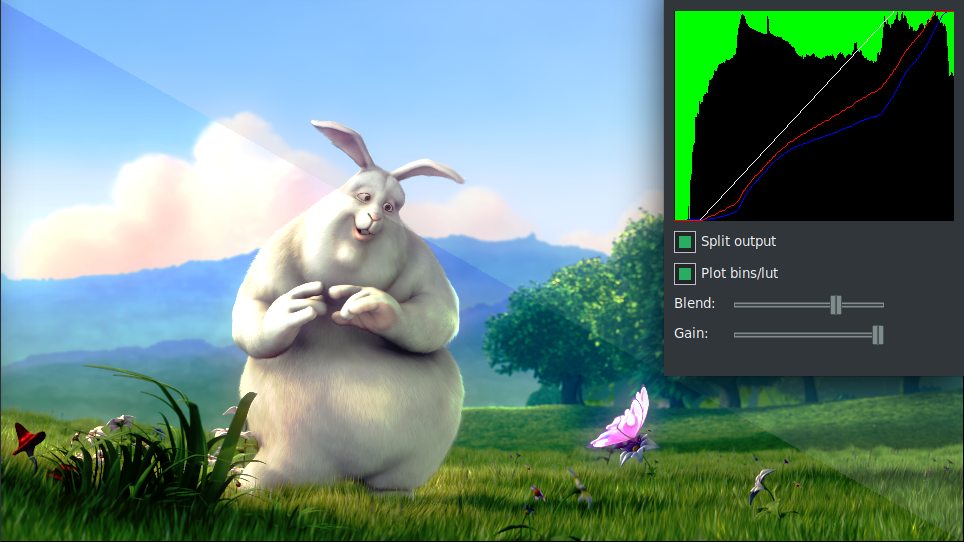
Remap colors using blended histogram weights. Figure 10.49 shows the GUI and the results in a split screen.
If the histogram is as wide as the entire range (0 - 1.0), the image is high contrast. If the range is small (i.e., the values are close together) the contrast is small. In this case HistEQ is used to distribute the few clustered values across the entire range (0 - 1.0), increasing the contrast of the frame. In order to do this HistEQ equalizes the colorspace through use of a histogram equalization algorithm. Parameters are:
The CINELERRA-GG Community, 2021