Next: Wave Up: Video Effects Previous: Unsharp Contents Index
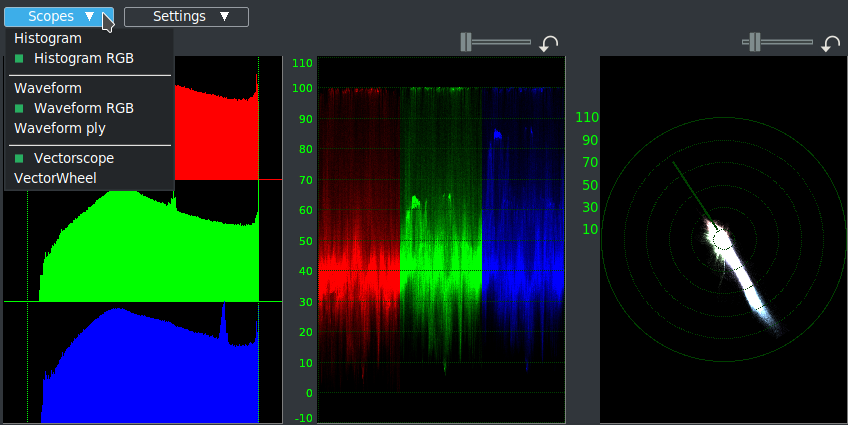
Videoscope summarizes intensity and color on a calibrated display. The Videoscope can be used in conjunction with other CINELERRA-GG plugins such as Color 3 Way, YUV, Brightness, Color Balance or Histogram to accurately correct video for contrast, clarity, conformance (to normalize various videos shot under different light settings), or for cinematic purposes. The human eye is not specialized to match precise level of light and color, but Videoscope is. Videoscope contains three displays: the waveform scope and the vectorscope, plus the histograms (figure 10.74). Instead of applying the plugin to the tracks/edits we want to examine, we can use the Videoscope buttons in the Composer and Viewer windows. ![]() In this way the monitors act on the frame indicated by the insertion point, without taking into account the stack of tracks or on which edits to apply the plugin.
In this way the monitors act on the frame indicated by the insertion point, without taking into account the stack of tracks or on which edits to apply the plugin.
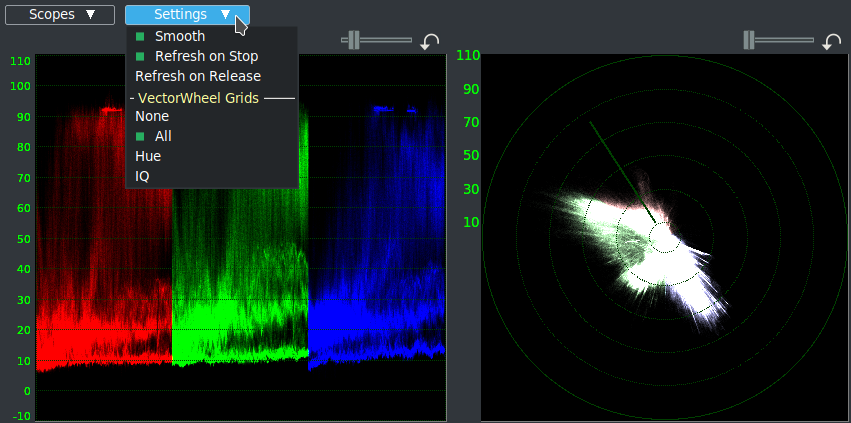
When using the X11 graphics driver and RGBA-FLOAT color model, Videoscope allows you to display greater than (0 - 1.0f) values to accomodate HDR. This does not work when using X11-OpenGL because it is an 8-bit limited driver. The display will stop at -10% or +110%, but there is no clipping. For example, by varying the brightness all out-of-range values become visible on Waveform, even over 110%. However you must disable the "smooth" option which always causes clipping.
The Videoscope menu window has many options.
The lower section, called VectorWheel Grids, it is only active when VectorWheel is set up in Scopes pull-down and contains four entries (figure 10.75):
You can create custom grids. These are raster .png images of adequate resolution and must be put in:
[your cinelerra path]/bin/plugins/scopes/custom_grid.png |
More information in the later section on Vectorscope.
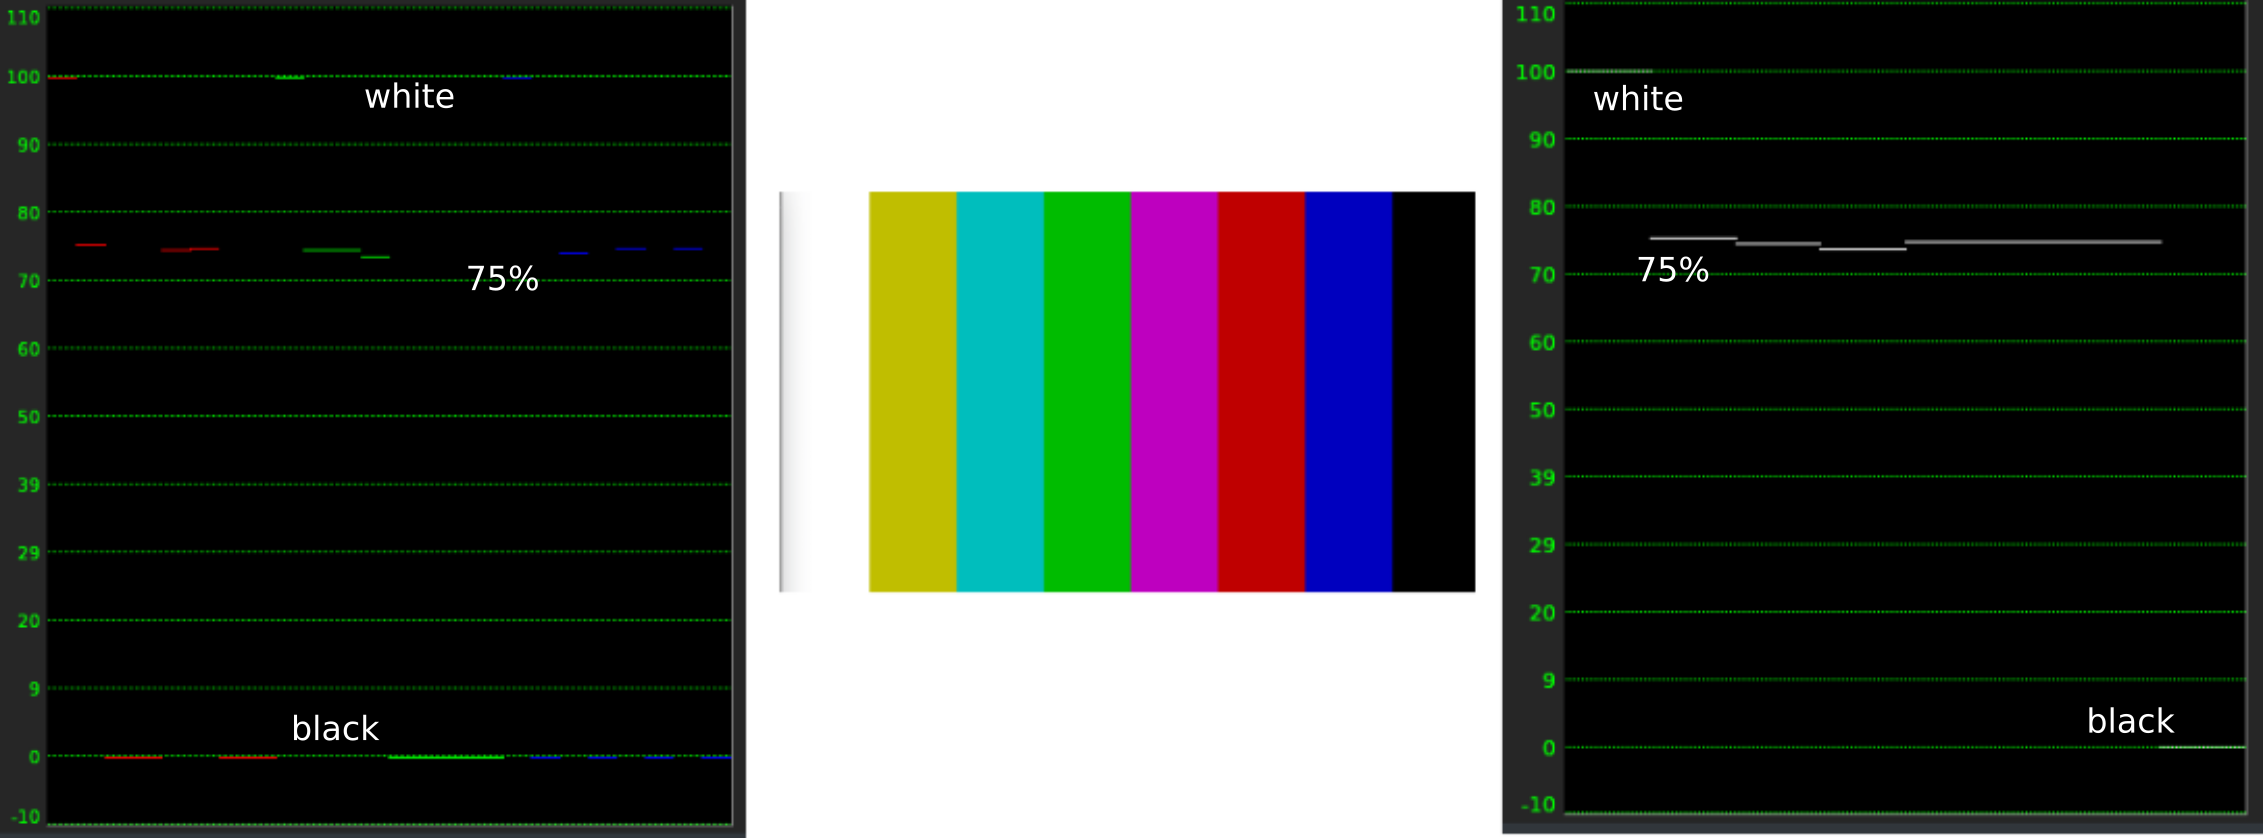
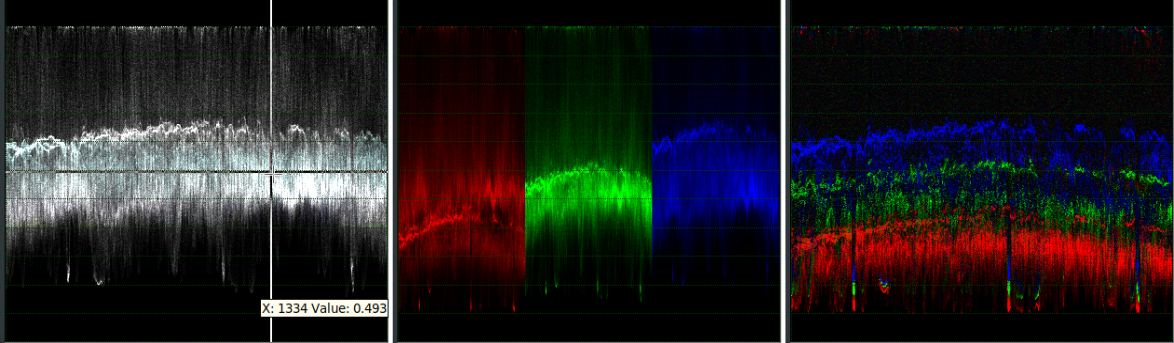
The Waveform Scope displays image intensity (luminance) versus image X position. The Waveform RGB displays image RGB intensity versus image X position (one graph per channel). The Waveform Ply shows the three channels in a single graph. The Waveform Scope appears on the left side or in the middle of the Videoscope window. The display is calibrated vertically from 0% intensity (black) at the bottom up to 100% intensity (white) at the top. Each column of pixels in the image corresponds to one column of pixels in the Waveform Scope (figure 10.76). Note that the height of the values of a waveform/waveform RGB corresponds exactly to the values on the x axis in the histogram. A vertical/horizontal correspondence is therefore obtained.
On the left is shown waveform RGB: instead of the color shadows as in figure 10.74, we have lines representing the color bar test at 75%. They are pure colors, so all pixels have the same value. In fact, they are all at the level of 75% except for the 100% white band and the 0% black band. In the waveform on the right, we have the same behavior with regard to luminance: the white band is 100%; the black band is 0% and all the others 75%.
If we left-click on the graph with the mouse, we will see a crosshair that we can place exactly where we want to measure. We can read the precise values of X and Luminance (Value) in the pop-up box that appears at the bottom right (figure 10.77).
|
The Waveform scope helps correct image light levels for contrast range or for conforming light levels on various scenes originally shot on different light settings. The same can be done with Waveform RGB or the convenient overlapping representation (Waveform Ply).
For example, if you are looking for maximum contrast range, adjust the Brightness/Contrast levels to align the darkest point on the scope with the 0% level and the brightest portion with 100%. Anything above 100% is over saturated. Limits may be highlighted with checkbox controls.
The maximum pixel range for HDTV or sRGB is [0, 255]. This range corresponds with levels 0% and 100%.
For analog video or MPEG (including DVD), the maximum range for RGB is [16, 235] (8 bit). For YUV, the maximum range for intensity (Y) is [16, 235] (8 bit). This range corresponds to gray levels from 6% to 92%. Reference RGB-601 plugin.
If you are producing a video for NTSC television broadcast, keep the intensity between 7.5% and 100%. The minimum black value which can be broadcast is IRE 7.5% (indicated by the 7.5 level), and values below this level are no darker.
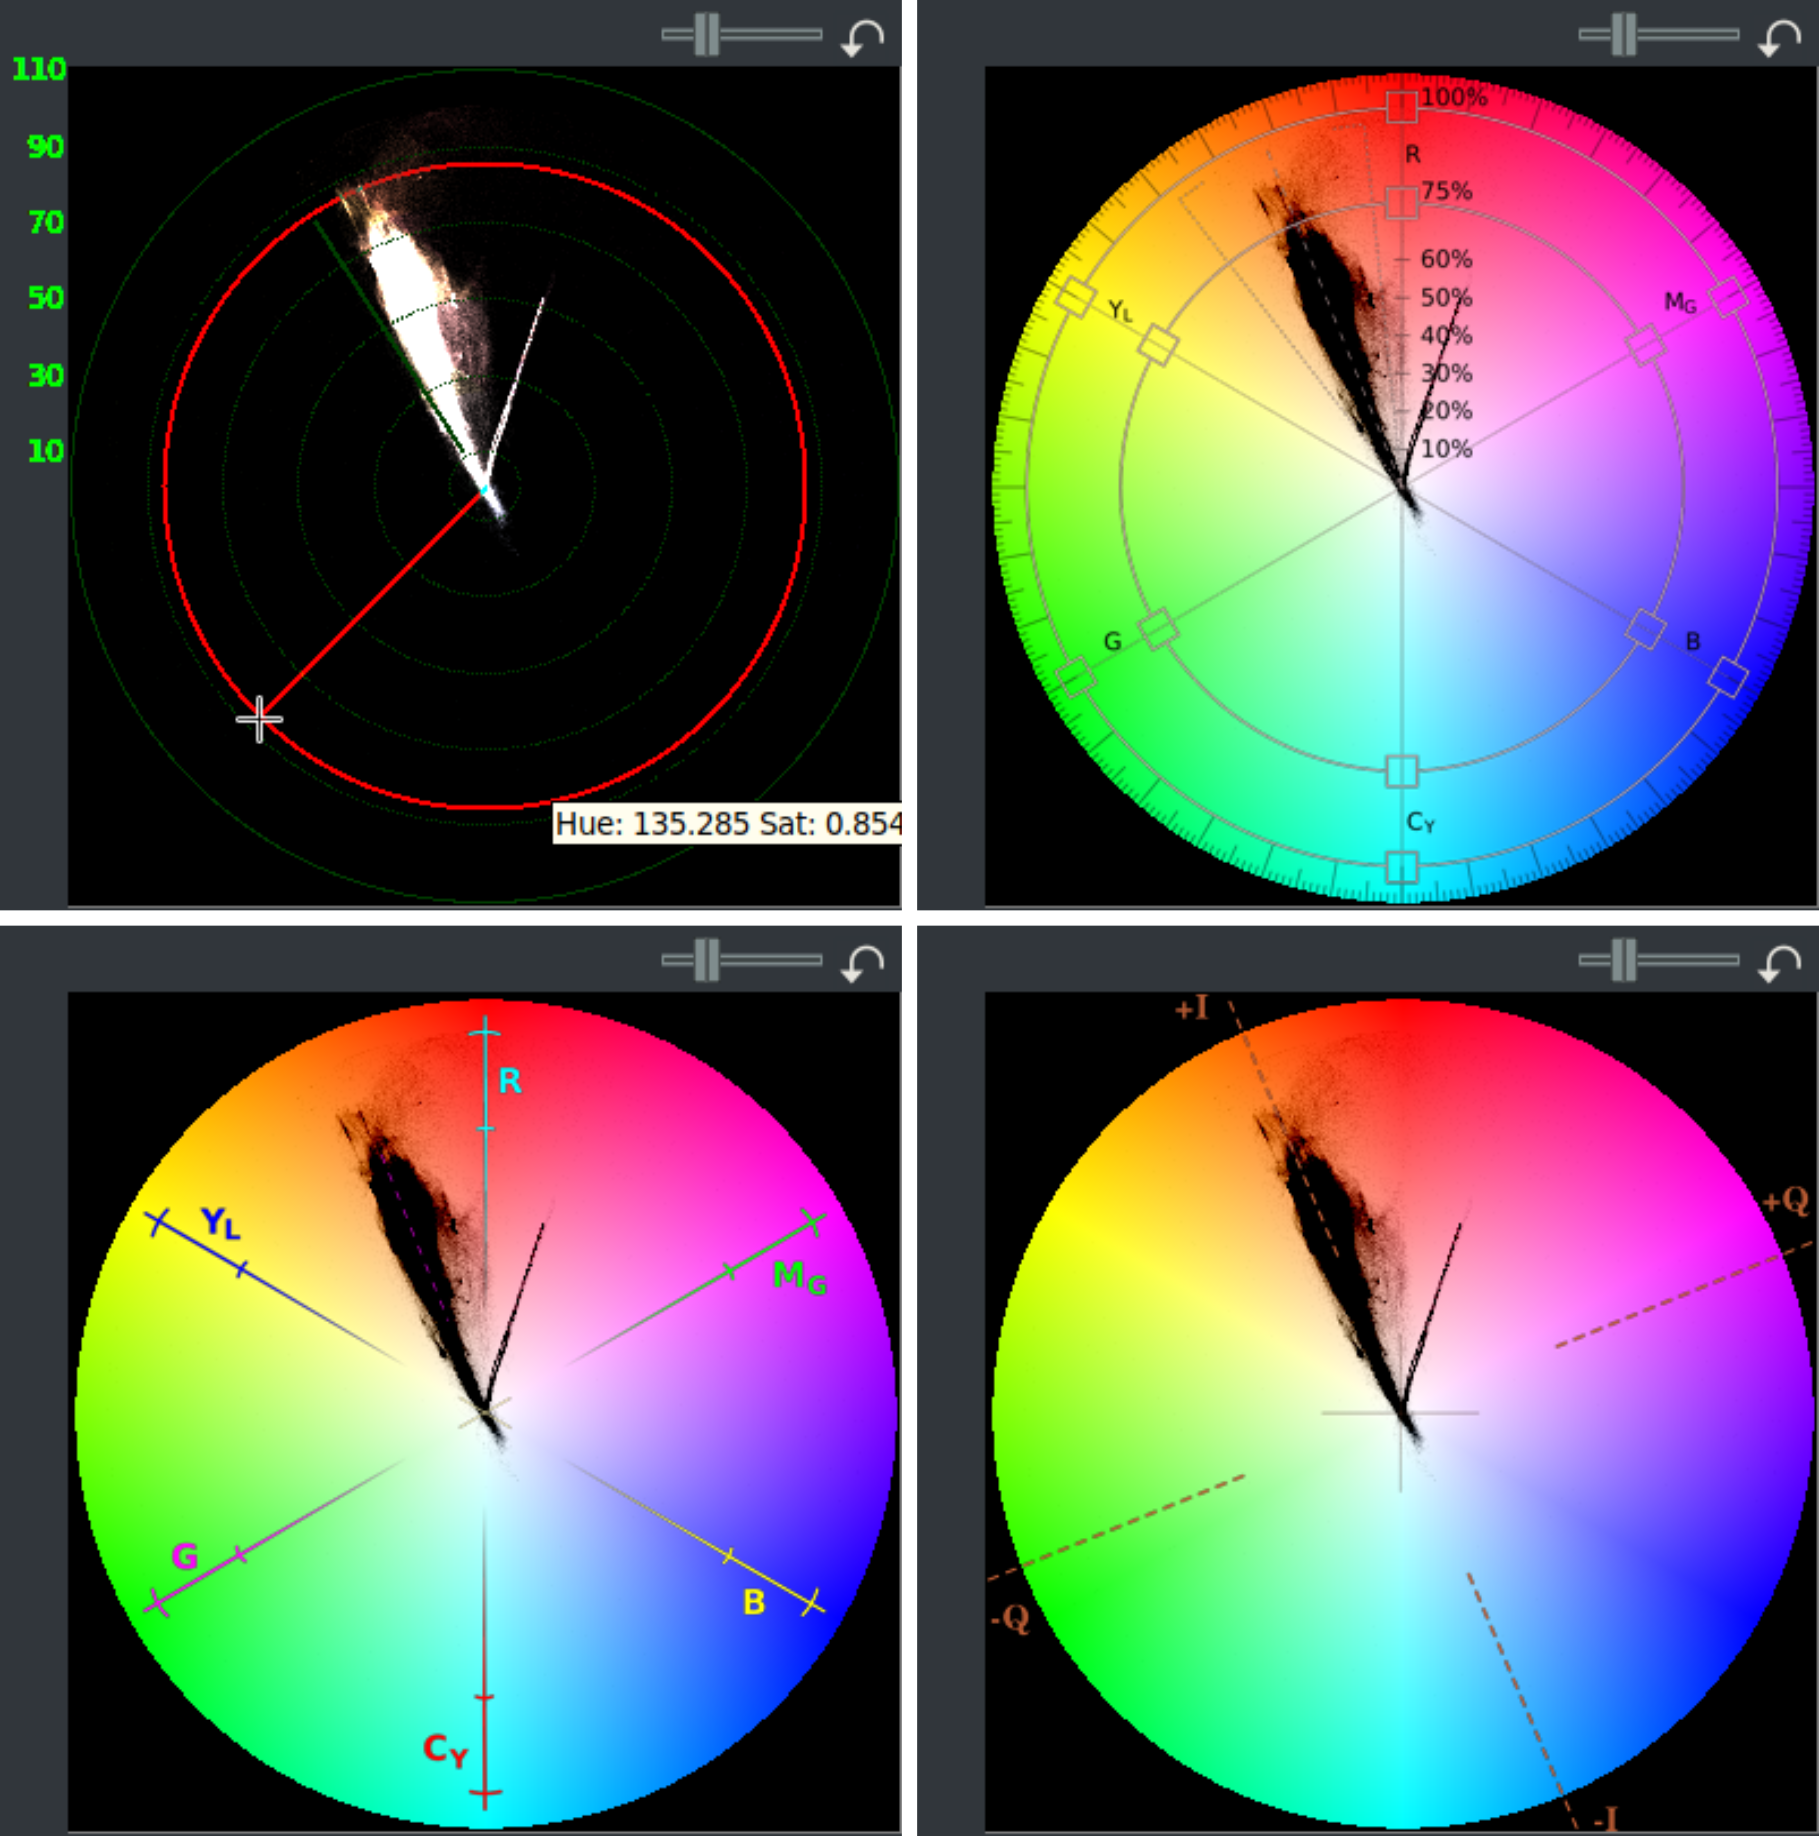
The Vectorscope displays hue (angle on the color wheel) and saturation (radius). Each pixel in the source image is drawn as a point on the color wheel. The distance from the center is the color saturation. Gray values are close to the center, and high saturation values are near the perimeter (100%). In the center there is pure white (0%). By clicking with the mouse on the color wheel a radius and circle will appear whose values of hue and saturation are shown in the pop-up box at the bottom right of the window, similar to the values of X and luminance of the Waveform and RGB Parade (figure 10.78).
Note that when you choose VectorWheel from Scopes pulldown, you can choose between different grids in the Settings pulldown. In addition, any number of user-supplied grid patterns can be added in the form of a square image of type png. The user can design and maintain individual grid overlays for various purposes. The user would keep their overlays in a safe spot on their disk and make a copy of them in the {cinelerra_pathname}/bin/plugins/scopes every time a new version of CINELERRA-GG is installed.
Generally the Vectorscope has the following uses:
For example, skin tones are found along an axis (+ I-line) between yellow and red, and between 0 and 50% saturation values. The blue of the sky is more or less along the opposite axis to that of the skin (- I-line), with a much wider saturation range.
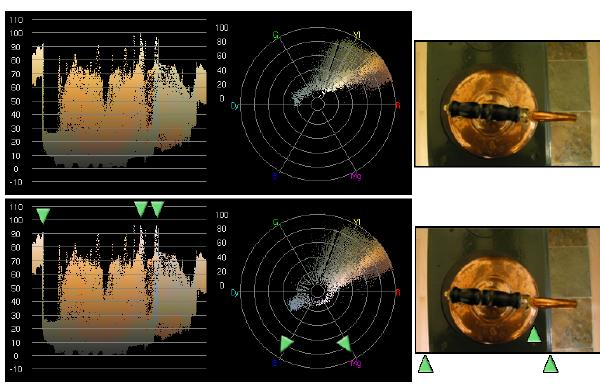
In figure 10.79, the top image is white balanced. Vectorscope shows many pixels in the yellow region and few in the white region. To remove the yellow tint, the Color Balance effect is used to first shift the vectorscope plot towards magenta (Mg), and then towards blue (B) until the region previously near the center surrounds the center. In the bottom image, yellow highlights have become white highlights (green triangles). Note that the corresponding features in waveform also appear whiter (green triangles). The Vectorscope can also be used to verify that the video output will display properly on various monitors. Any points along the inner radius will be displayed as pure white and any points above the 100% radius, will probably not be correctly displayed on the screen.
You can also display the 4 histograms (master or RGB) on the left of the window. (see figure 10.74).
The CINELERRA-GG Community, 2021